Archive for the ‘Water quality’ Category

Vision Environment joins Trinity Consultants, expands service offering

Friday, June 26th, 2020

Vision Environment is thrilled to announce it has joined global environmental services group, Trinity Consultants, who have businesses and teams operating in the United States, Canada, the United Kingdom, Asia and Australia.

Trinity acquired VE in early June, adding VE’s specialist skills and expertise in water quality monitoring and marine ecology to its regional portfolio.

Read Trinity’s announcement.

VE founders Dr Leonie Andersen and Dr Felicity Melville will continue to manage the business while partnering with Trinity to pursue expansion opportunities.

Specifically, VE hopes to collaborate on future projects with Trinity’s two other Australian firms, ASK Acoustics and Air Quality, and Air Noise Environment (ANE). Together, they are now able to offer clients comprehensive environmental monitoring services, encompassing water, air and noise.

Technical knowledge-sharing

Trinity Director Brian Burdorf, who provides oversight for the firm’s operations in Australia, said Trinity was very excited about the additional resources and capabilities the VE team brings and Trinity’s continued growth in Australia.

“Leonie and Felicity have developed a team of technical experts that are leaders in the field of water quality monitoring and assessment serving the marine ecology needs of their clients.

“We look forward to helping them further grow the business throughout Australia, New Zealand, and beyond.”

Leonie, meanwhile, said the VE team was pleased to be pursuing new opportunities while continuing to provide high quality real-time environmental monitoring to current and future clients.

“We believe Trinity’s broad span of physical locations and technical expertise will result in opportunities for expanded services for our clients and technical knowledge-sharing.

“We look forward to teaming with Trinity’s Australian operations.”

VE partners with clients for the long term

Friday, April 3rd, 2020

In the age of cloud computing, 24/7 connectivity and the Internet of Things, data is undoubtedly one of a business’s greatest intangible assets.

It follows that data integrity is essential. Vision Environment has been collecting high quality, real-time environmental data for more than a decade and many of its clients have been on board for the long term.

“Five, six, seven year or even longer partnerships with our clients are not unusual,” says Leonie Andersen, director at VE.

“Environmental monitoring has evolved to the point where companies aren’t just looking at it as a compliance check box,” she says.

“People see themselves as custodians of the waterways and ocean areas in which they operate and they want to be proactive about protecting them.

“One of the best ways to do this is to build a bank of high quality data over time. This enables you to establish benchmarks and norms, immediately flag any changes, and confidently assess the causes of these changes.

“Our clients trust us to deliver quality data and scientific rigour, time and again.

“Of course, from a regulatory point of view, a solid baseline of environmental data is always an encouraging thing to provide in a permit application, too.”

Vision Environment offers services including telemetry, water quality and sediment monitoring and ecological monitoring and assessment.

This month, we are profiling a few of our longer-term clients and the great work we continue to do together.

Queensland Alumina (QAL): 2015 to 2023

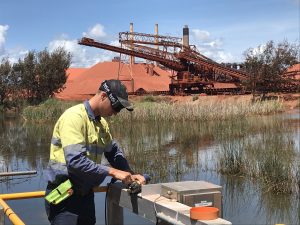
VE undertakes the calibration, maintenance and management of data of water quality instruments at six real-time monitoring stations on-site at QAL.

We replace and/or clean measuring sensors and then check the readings against our own sensors to ensure they are both reading the same.

The major parameters we monitor at QAL include:

  • Flow rates
  • pH
  • Dissolved oxygen.

Each monitoring station is telemetered and sends the recorded sensor data both to our VECloud server and to QAL for real-time data viewing.

We also undertake regular water quality sampling in the marine receiving environment around QAL, with both real-time data stations and manual sampling.

Port Curtis Integrated Monitoring Program (PCIMP): 2006 to 2022

PCIMP is a collaboration between industry, government and research bodies. It conducts ambient mid to far field monitoring of water bodies for the whole of Port Curtis.

VE undertakes quarterly water and sediment sampling and analysis for PCIMP at 54 sites. Monitoring takes place using handheld WQ meters, discrete water sampling and, until recently, biomonitor organisms (transplanted oysters).

Quality assurance and control components are extensive, including duplicates, triplicates, and analysis at primary and secondary laboratories.

VE is additionally responsible for data collation and annual report writing.

The data we collect is also provided to the Gladstone Health Harbour Partnership for its annual report card, making this ongoing monitoring an excellent example of the environmental value that can be created when multiple parties commit to investing in a long-term data source.

Gladstone Ports Corporation (GPC): 2008 to 2021

VE has a long history of working with Gladstone Ports, currently as part of the Clinton Vessel Interaction Project (CVIP), for which dredging kicked off in February 2020.

Among other work with GPC, VE looked after water quality monitoring for the three-year Western Basin Dredge project in 2010 and the Chanel Duplication EIS 2015. It has also run monitoring for the port’s last seven maintenance dredging programs. All of these projects rely on real-time data for dredge management backed up by manual sampling.

Our detailed understanding of the area’s natural expected background conditions is supported by the years of high quality data that we have collected and analysed.

We also know the port area inside out and we are used to dealing with typical Queensland coast challenges such as bouts of wilder weather. We know what to expect and how to safely ensure minimum disruption to our monitoring services.

Lyttleton Port of Christchurch (LPC): 2016 to 2020

Lyttleton’s channel deepening, widening and lengthening project is New Zealand’s largest dredge project and the longest dredge project VE has undertaken monitoring for.

VE was involved from the start, coming on board in 2016 to help LPC design a monitoring program that incorporated world’s best practice.

At the peak, we had permanent field officers based in Christchurch and other support staff from our scientist and analyst team flying over as needed.

We still have buoys in the water, conducting real-time monitoring today, although requirements have evolved as the initial phases of the project near completion.

Jared Pettersson, project director at LPC, notes the quality and reliability of the data has been excellent for the entire period we’ve been in the water.

LPC now has a comprehensive bank of high quality data that captures their water quality and sedimentation characteristics over four years.

Not only does this provide LPC with an invaluable business resource to assess potential impacts of any future projects, it has also helped to build a strong trust connection between LPC and the community. LPC uses our real-time data dashboard to feed their excellent Harbourwatch website, which facilitates greater environmental transparency in an area that is used for recreation, research and industry.

What to look for with your environmental real-time data software

Monday, December 9th, 2019

At Vision Environment (VE), we’ve spent more than a decade refining our software. We’ve invested heavily to create customisable dashboards that are purpose-built for water quality and marine monitoring. And we’ve learnt a lot along the way.

Leonie Andersen, director at VE, says choosing the right environmental monitoring software at the start of your project will help you to avoid huge headaches down the track.

So how do you know what to look for? Here are Leonie’s top questions to ask.

Will your data update in real time?

“If you want to manage a dredge in real time, you absolutely must have real time data,” she says.

“I know I say that a lot, but it’s crucial. I’ll give you an example of why.

“A while ago, one client had a dredge in operation and, over a couple of hours, they started to notice an exceedance in turbidity or muddiness, higher than they would have expected, resulting in poorer water quality and going above their internal trigger alert.”

Can the platform send trigger value exceedance alerts by email and text?

“The client’s environmental manager received an instant text message alert. He was able to make the right calls and instigate management procedures to mitigate the impact and prevent the turbidity from going even higher and triggering an external notification alert.

“The issue was resolved and the client was back on track within the day. They avoided any reportable environmental incident and, most importantly, any environmental harm.

“Our Vision Environment team—who receive the alerts too—are also able to mobilise rapidly, getting out in the water within hours to physically assess the situation if that is what is required.”

Can you view data from any time frame from the project, at any time?

You never know when an internal or external stakeholder is going to come up to you, possibly many months after project completion, and ask ‘what was the environmental data for [this] period?’.

Or you may later need to verify what the levels of turbidity were during a certain phase of the project – possibly for comparison or establishing a benchmark for future project proposals.

“Don’t take this as a given,” Leonie suggests. “Check that if you are seeing data displayed in real time, the system is also capturing it all and processing it in a way that enables you to easily go back and search by date ranges.”

“One of our clients is in their fourth year of monitoring and because the data is stored in VECloud they can instantly go back to data collected from that first day of monitoring.”

Can you see your trigger values in an easy display traffic light system?

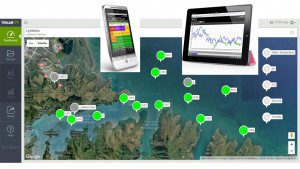
“As you might guess, the Visual KPI system we have customised to use with our clients has a very visually intuitive interface,” says Leonie.

Clients’ dashboards will normally be set up as a map of their dredge area, with each monitoring station plotted and its target and exceedance levels input.

“The traffic light system allows multiple project stakeholders, as desired, to keep track of top line environmental metrics at a glance.

“The ‘amber’ traffic light programming (internal alert) is particularly useful, as it allows you to manage your project very proactively.”

Can you drill down into plots and data for detailed information?

If you do identify a potential problem or receive a trigger alert, you will want to be able to investigate what’s going on promptly.

“What you don’t want is to waste your time going back and forth, trying to cross reference map points with complicated data tables,” says Leonie.

“A display that allows you to simply click on a monitoring site and see all its detail will save you more time than you might be able to imagine upfront.”

Can you write comments on a plot and share the screen with colleagues?

“I’ve lost count of the number of times I’ve seen important and very specific information about data plots get lost in translation between emails,” says Leonie.

Try to eliminate as much room for error as you possibly can when it comes to discussing your data.
Get everyone on the same page by using a system where comments can be made directly onto the dashboard plot and then shared, within your system, with colleagues.

Can you view your data anywhere and on multiple devices?

If you’re managing or involved in a dredge project, chances are you’ll need to be away from your desk (and possibly your office) quite a lot during the process.

You want to be able to access your data, securely, on any computer.

You may also need your data to “travel with you”, as Leonie puts it, on weekends or to remote locations.

“Our platform is browser-based, which means you can log in anywhere using your regular internet browser, like Google Chrome or Internet Explorer,” she says.

“The interface also works well on tablet, so you can take it out into the field with you quite easily.

“And you can set up alerts to go straight to your phone via text message if there are any issues.”

Can you download the data in Excel?

There are all sorts of reasons you might later need to download your data in Excel.

For example, you might have to store the data in organisational record-keeping systems or show it to a regulator at any point.

“Other times, it’s things like creating different charts and graphs for reporting purposes,” Leonie says.

“It’s good to know you have that flexibility.”

Can you have public and private versions of your dashboard?

“Over the years, we’ve seen a big change in how transparent companies wish to be with the data they collect,” Leonie says.

“Many of our clients have worked hard to implement best practice and ensure a high standard of environmental protection.

“They want the public to feel comfortable they are taking care of the areas in which they operate.”

That said, the exact same interface is not usually fit for purpose for internal management and external viewing.

“So, you want to look for software that allows you to run two versions of the same data dashboard – i.e. a lay person view for the public and a detailed interactive dashboard for the environmental managers, but without any manual inputs required on your part once it’s up and running.”
VE to monitor Clinton Vessel Interaction Project

Wednesday, October 30th, 2019

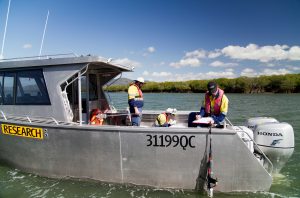
Vision Environment buoyVision Environment (VE) will undertake an estimated nine months of water quality and light monitoring for Gladstone Ports Corporation as part of the Clinton Vessel Interaction Project, providing the port with high quality data that will enable real-time environmental management.

The project aims to widen the Clinton Channel by moving around 800,000m3 of material.

As per the government-approved CVIP Monitoring Procedure, fifteen sites in total will be monitored by VE, spanning from The Narrows to Rodds Bay and measuring water quality (specifically, turbidity) and light levels near and at sensitive receptor sites within Port Curtis.

Leonie Andersen, director at Vision Environment, says VE will also assist GPC to implement adaptive management and mitigation measures to avoid and minimise potential impacts of dredging activities on sensitive receptor sites.

“For water quality, we will use real-time buoys that monitor turbidity levels and transmit this data directly to a dashboard that we create for the client.

“Likewise, we will measure, in real time, benthic photosynthetically active radiation levels—meaning, how much light is reaching seagrass to ensure they are able photosynthesize—and transmit this to the dashboard too.

“Monthly manual water quality sampling will also be conducted to measure nutrients and contaminants,” she says.

Compliance and transparency

Leonie notes this dashboard reporting is one of the elements that makes VE’s service so crucial to its clients.

“For compliance projects, we set up a customised dashboard. It can be accessed by the client anytime; however, they will also receive mobile or email alerts if any exceedances are triggered or approach threshold levels.

“This allows them to truly manage their dredge in real time,” she says.

“Companies feel confident they can rely on us when it comes to meeting both regulatory requirements and the public’s expectations for full transparency of compliance data.”

In addition to a client dashboard, VE will enable Gladstone Ports to provide a public site showing real-time water quality data.

“Although this monitoring is as a standalone project, VE has a long history of working with Gladstone Ports” says Leonie.

“VE were responsible for the water quality monitoring for the three-year Western Basin Dredge project in 2010, the Chanel Duplication EIS 2015 and the last seven maintenance dredge programs for GPC since 2014.

“Therefore, we have a detailed understanding of the area’s natural expected background conditions, which means we can add significant value in terms of proactively minimising any potential environmental impacts.”

Proprietary instrumentation and technology

Carsten Wolff, Research & Design Manager, says VE will also use an instrument they have developed themselves over the past five years to measure continuous sedimentation rates (deposition or erosion of sediments and change in bed level) at two sites.

“We found the existing approach of using sediment traps was inadequate as they only measure the amount of sediments being deposited, but not the net transport overall, as sediments can remobilise quite quickly.

“It’s important to measure actual bed level change to determine if there is any smothering of sensitive habitats like coral and seagrass. So we have designed, developed and refined our own instrument over time, which is similar to a side scan sonar.

“It has proved invaluable over a number of projects” he says.